Showing posts with label graph. Show all posts

Wednesday, October 1, 2008

#47 Parallel Coordinate Graph

A parallel coordinate graph is used to plot large numbers of datasets. Certain relations can be obtained through using such a graph.
>Source: http://www.iwi.uni-hannover.de/lv/seminar_ss05/bartke/Assets/parall2.jpg

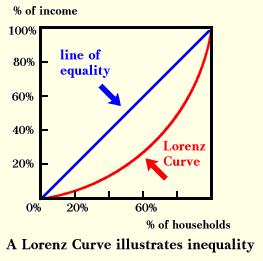
#40 Accumulative Line Graph or Lorenz Curve

A Lorenz curve is a function of a sizable proportion of ordered individuals mapped onto the corresponding cumulative proportion of their size. A lorenz Curve is commonly used when graphing economical conditions. This lorenz curve graphs the cumulative proportion of percentage of income and the cumulative proportion percentage of households.
>Source:
http://ingrimayne.com/econ/AllocatingRationing/Figure6.5.gif

#39 Bilateral Graph

Bilateral graphs depict two different varibales on the same graph. Values can be either negative or postive. This graph involves humanitarian aid and shows countries' either growth or retraction in the amount of aid given in 2005 throug 2006.
>Source: http://www.globalhumanitarianassistance.org/New%20Images/Growth%20in%20bilateral%20humanitarian%20assistance%202005-2006%20copy.jpg