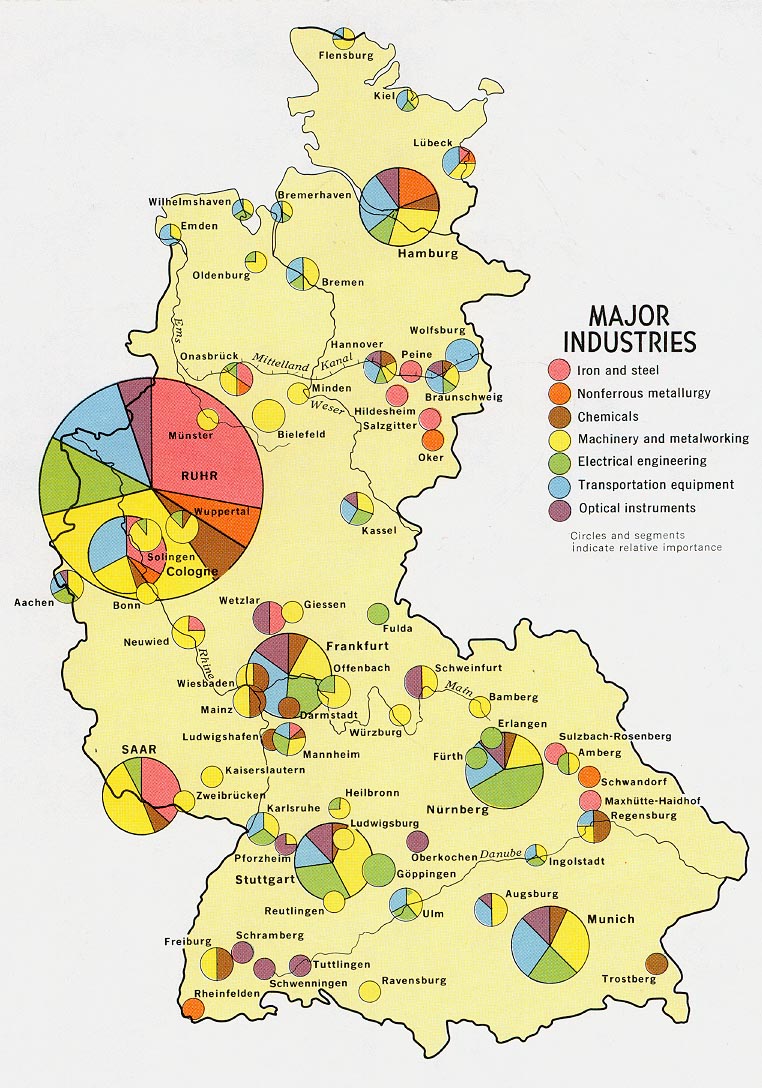
>Source: http://mapmaker.rutgers.edu/355/dotProporCircle.jpg
Range graded proportional circle maps use evenly graded circles to show their data. There is a set number of sizes that can be used, unlike variable maps which exhibit size variation.
Range graded proportional circle maps use evenly graded circles to show their data. There is a set number of sizes that can be used, unlike variable maps which exhibit size variation.


 Proportional circle maps display data via circle representation. The larger the circle indicates the larger the data in value is. This proportional circle map shows the American Indian Population in several states in he U.S. Oklahoma and Arizona have the largest populations of Indians.