Showing posts with label Choropleth. Show all posts
Showing posts with label Choropleth. Show all posts
Wednesday, October 1, 2008
#38 Nominal Area Choropleth Map
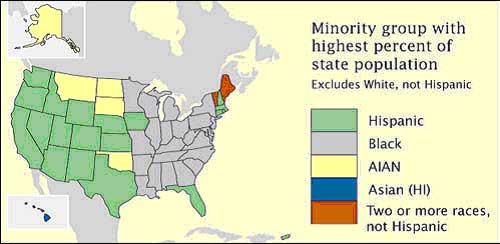
A nominal map displays a qualitative classification of different groups. This particular map depicts what states were suppose to the democratic canidate and which ones were suppose to go to the Republican canidate during the 2008 election.


#37 Unstandardized Choropleth Maps
 Unstandardized choropleth maps depict unordered categories on maps. There are no rankings or layerd data but important information is still displayed.
>Source: https://courseware.e-education.psu.edu/courses/geog482/graphics/citationexample.jpg
#36 Standardized Choropleth Maps
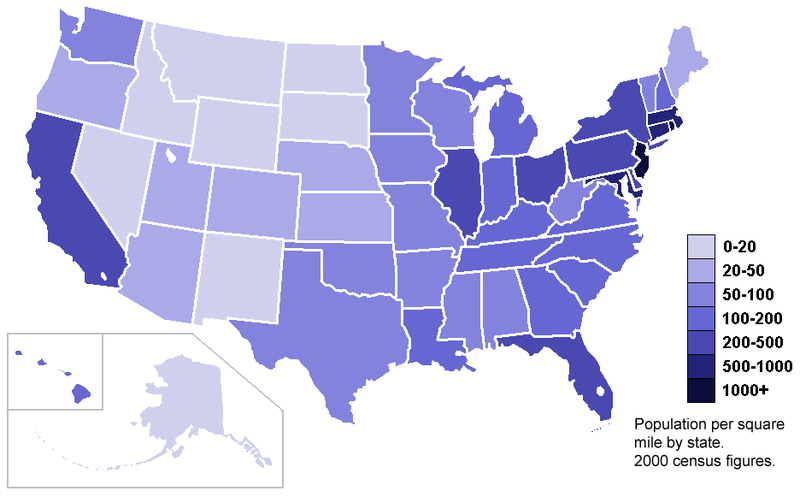
Data displayed on choropleth maps has been standardized or set to the same standard to allow readers to compare data from different locations from withon the map. The map below shows population per square of the United States on a state by state basis.


#35 Univariate Choropleth Maps
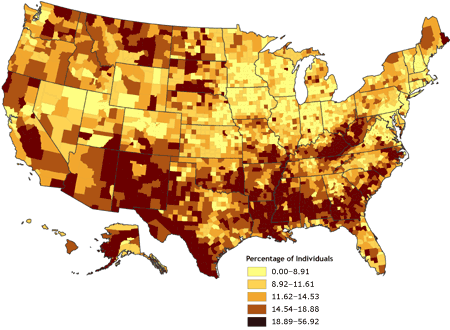
 A univariate choropleth map displays a single set of data via coloring or unique shading .
This particular univarite choropleth map shows wer poverty exists in the United States.
>Source: http://www.cdc.gov/pcd/issues/2007/oct/images/07_0091_02.gif
>Source: http://www.cdc.gov/pcd/issues/2007/oct/images/07_0091_02.gif
#34 Bivariate Choropleth Maps

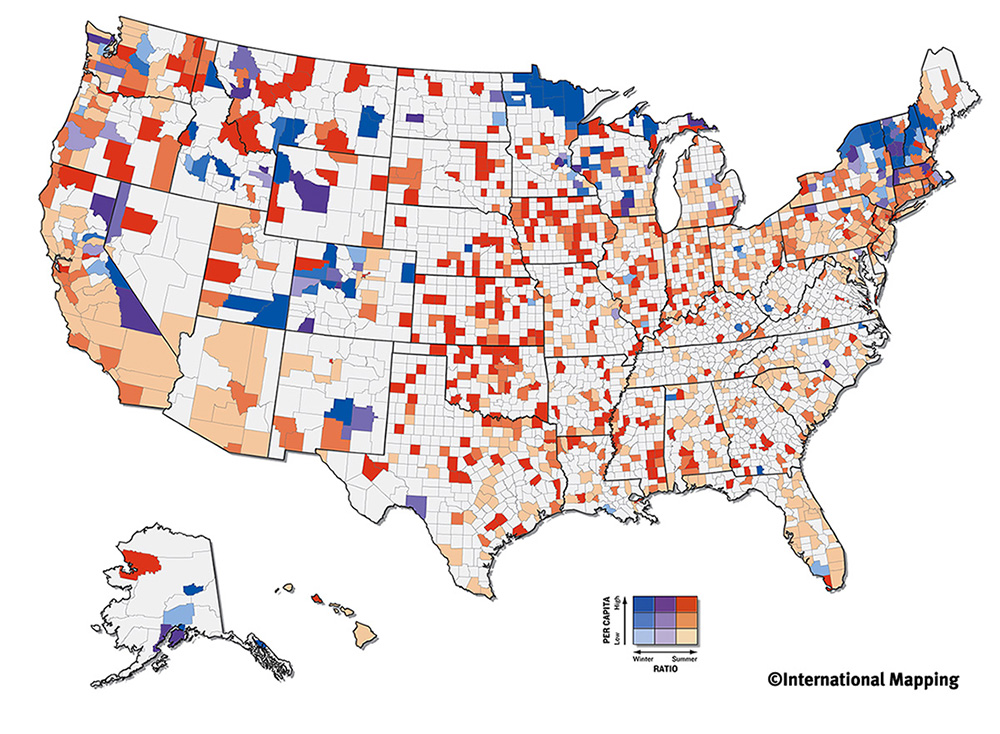
These types of complex maps display two or more different variables, all on the same map. Coloring or types of shading is used to show the multiple pieces of data on the map. Even though variables are different, they more than likely are related to the same topic. The map above deals with olympic atheletes and shows where both the winter and summer ones come from and to what exntent.
#33 Unclassed Choropleth Maps
Unclassed choropleth maps are colored in order to show data, but the values that are being colored are not dependent upon each other. This technique assigns shadings based on the fact that different values are only proportional to each other and on the same map. The map below shows the density of lightenting that occurs in the country per area.

#32 Classed Choropleth Maps
 A classed choropleth map displays data through the use of colors. These colors are of the same shade but vary in lightness and darkness. Only one variable is mapped out, but one can see how this variable changes from area to area. The example map shows the percentage of hispanics per county in Florida.
>Source: http://www.ilstu.edu/~jrcarter/Geo204/Choro/Tom/hispanic_race_fl-H1_FINAL.gif
Thursday, September 25, 2008
#10 Choropleth Maps
Choropleth Maps are thematic maps in which areas are shaded in accordance to the variables being displayed. Some sort of boundaries or political borders a re depcited and used on the map. The map of this type below shows where hay is produced in the United States, by county. The counties that are in the darkest shades of green produce the most hay.

Subscribe to:
Posts (Atom)