
These types of maps show the spreading out of objects or ideas from one location to many. In this particular map, Europe serves as the origination point for this particular object or idea and spreads out to multiple locations around the world.
Thursday, September 25, 2008
#12 Isoline Maps
Maps that use lines to connect areas of data of equal values are known as isoline maps. Isolines are those lines that connect the equals values. Lines can make it easy for readers to see like values; where precipiation falls in equal amunts is easy to pickup on, on the map of Mexico.

>Source: http://www.lib.utexas.edu/maps/atlas_mexico/mean_annual_precipitaion.jpg

>Source: http://www.lib.utexas.edu/maps/atlas_mexico/mean_annual_precipitaion.jpg
#11 Proportional Circle Maps
 Proportional circle maps display data via circle representation. The larger the circle indicates the larger the data in value is. This proportional circle map shows the American Indian Population in several states in he U.S. Oklahoma and Arizona have the largest populations of Indians.
#10 Choropleth Maps
Choropleth Maps are thematic maps in which areas are shaded in accordance to the variables being displayed. Some sort of boundaries or political borders a re depcited and used on the map. The map of this type below shows where hay is produced in the United States, by county. The counties that are in the darkest shades of green produce the most hay.

#9 Dot Distribution Maps
Dot distribution maps use some sort of symbol to represent where data exists geographically. This dot distribution map indicates where military families live in Ohio; each green dot indicates a different military family.


#8 Propaganda maps
Propaganda maps are as simple as the name reads. These type of maps are made purposefully to spread misinformation to the public through inaccurate depictions. They are made to persuade people in heir train of thought. Propagaanda maps were commonly used to spread misinformation during World War I and World War II. The followong map was produced by Germany and shows the results of what would have happened if Germany had gotten its way during World ar I.

>Source: http://strangemaps.files.wordpress.com/2006/09/sur-le-vif-germany-wins-001.jpg
#7 Hypsometric maps
 Hypsometric maps use color or types shading to help show a demention of data. This particular map depcits through the use of color, elevations of Tajikistan.
#6 PLSS maps

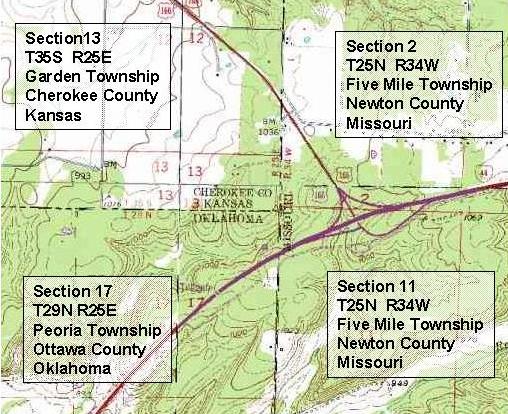
#5 Cadastral maps
 A cadastral map shows the boundaries and ownership of land parcels. Additional information details can be displayed on the map that helps distinguish ownership. Section and/or lots numbers are commonly displayed on these types of maps.
#4 Thematic maps
Thematic maps are ones that display a spatial distribution of an attribute of a single element. Usually, a thematic map displays a single attribute such as soil type, vegetation, geology, land use, or landownership. This particular one focuses on soil of the United States.


#3 Topographic Map
 These type of maps are two demensional and show the amount of change vertical in elevation. This specific map uses lines but can be depicted in colors as well.
>Source:http://content.answers.com/main/content/wp/en/thumb/6/6a/350px-Topographic_map_example.png
#2 Planimetric Map
A Planimetric map displays the horizontal position of features utilizing both lines and symbols. Vertical positions are not shown. Roads, buildings, and bodies of water are usually depicted on such map as like in this Chinesse map.
 >Source: http://www.loc.gov/rr/geogmap/guide/gm058002.jpg
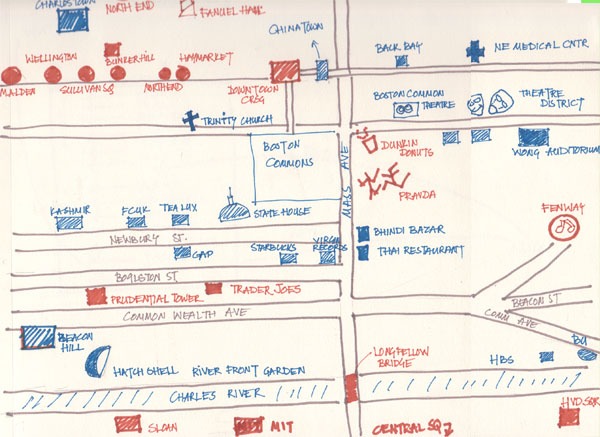
#1 Mental Maps
Mental mapping or ‘cognitive mapping’ is an imaginary image that human beings create in their minds in order to graphically grasp a particular object or set of objects. The hard part about mental mapping is actually interpreting what our minds envision since nothing is really set in stone.  >Source: http://ocw.mit.edu/ans7870/MAS/MAS.965/f04/assignments/tripti/Assignment10/MyMap.jpg
>Source: http://ocw.mit.edu/ans7870/MAS/MAS.965/f04/assignments/tripti/Assignment10/MyMap.jpg
Subscribe to:
Posts (Atom)
